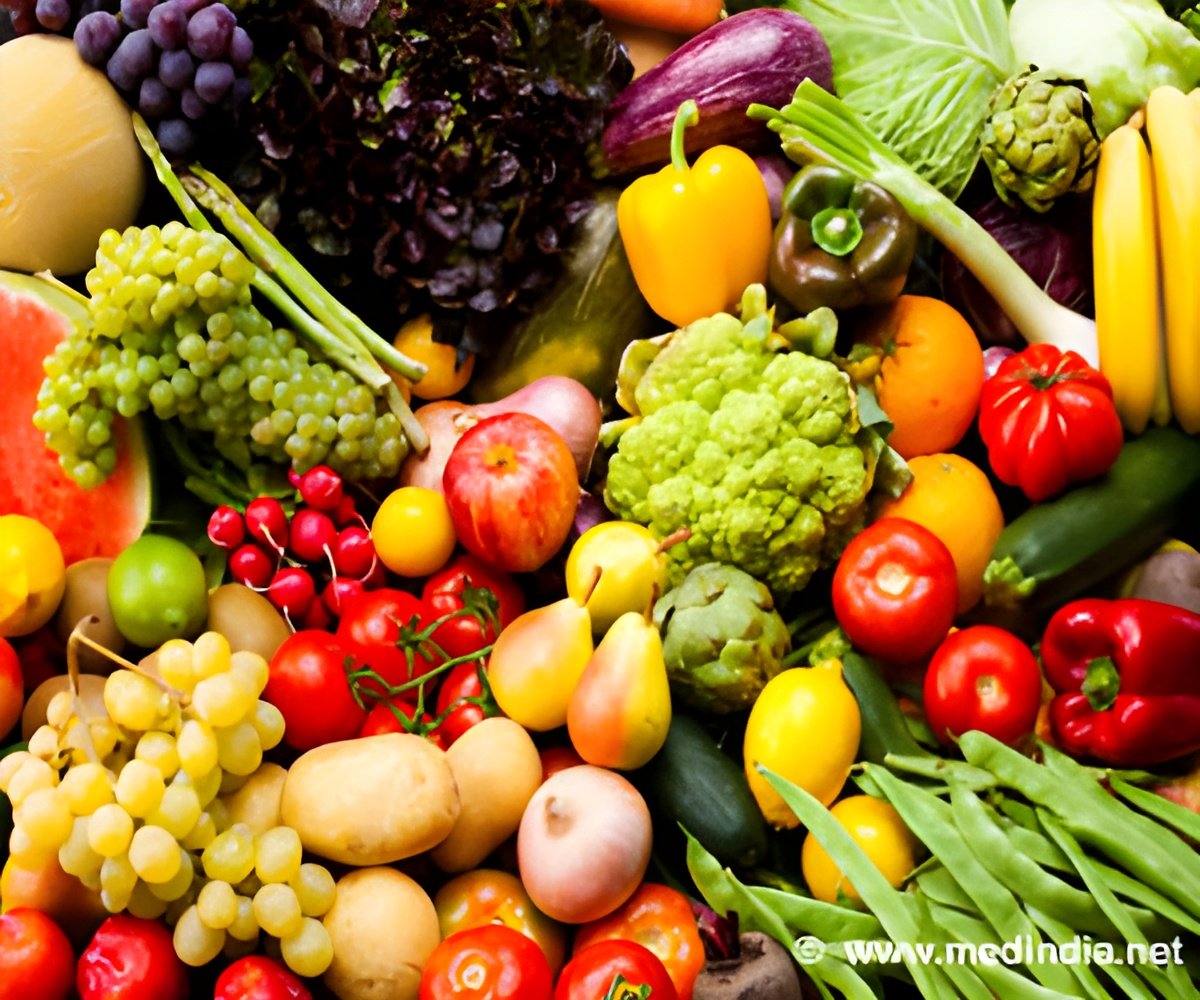
You can come across an explosion of vivid colors when you stroll through the produce aisle in your local grocery store or vegetable market.
"Previous formulas to measure color only worked for a portion of the color space and could give quite misleading results. For example, both reds and yellow-greens would end up with the same hue value," says Smith. "I felt there was a need to provide a more accessible explanation of this method for quantifying color." The new formula will enable researchers to obtain correct hue values for any color of interest. A full description is available for free viewing in the March issue of Applications in Plant Sciences.
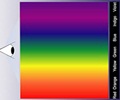
Interestingly, measuring color is actually a matter of analyzing light waves. When an object is exposed to light, its molecules absorb certain wavelengths and the appearance of color results from the unabsorbed light, which is reflected and filtered through the eye's retina. The ability of living organisms to reflect wavelengths of different portions of the color spectrum results in diverse displays like that of the grocery produce section. More importantly, color is involved in a wide range of biological phenomena. Flowers attract pollinators, fruits attract seed-dispersing animals, plants express stress responses, and organisms communicate with each other in many ways via color. Quantifying these variations is a crucial component of research.
"Color is one of the most conspicuous aspects of biological diversity and often carries adaptive significance," explains Smith, who is interested in understanding how and why new colors evolve in nature. When her research was limited by faulty hue values from previous formulas, she needed a new method to overcome this limitation.
Hue, or the type of color, is one of three components utilized in the segment classification method, one of the most popular systems for defining color. The other two components are brightness (lightness/darkness) and chroma (intensity/saturation). Together, these three variables offer a numeric way to describe the light reflected by an object. To calculate hue, brightness, and chroma, researchers use data from an instrument that can detect reflected light at different wavelengths—a spectrometer.
Using a spectrometer, a specimen is exposed to full white light and the reflected light waves are displayed as a curve on a graph. The size and shape of the curve, called a reflectance curve, is unique to each color. With red to violet wavelengths on the x-axis and 0–100% reflectance on the y-axis, a higher curve at a particular wavelength signifies an increased amount of light reflected at that portion of the spectrum. Researchers use mathematical formulas to calculate values for chroma, hue, and brightness from the reflectance curves.
Advertisement
"Refreshing my knowledge of polar and Cartesian coordinate systems was a challenging aspect of this study, but I'm sure my high school math teacher would be glad that some of those lessons came in handy!" says Smith.
Advertisement
"I hope that this new method and the accompanying description will provide users with confidence that they are obtaining the correct values. Any downstream analyses involving those results or any meta-analyses of studies using the segment classification method will rely on the quality of those initial calculations," says Smith.
Source-Eurekalert


