|
|
|
Font : A-A+ |
|
Indicators are established to monitor the health status of a given population and to evaluate the number of individuals affected by a particular disease within a given period of time and the total number of cases of that disease. It is also used to evaluate health risks and performance of health systems. Health status provides a broad overview of morbidity and mortality patterns of communicable and non-communicable diseases. Crude Birth Rate, Crude Death Rate, and Life Expectancy are the parameters for this indication. 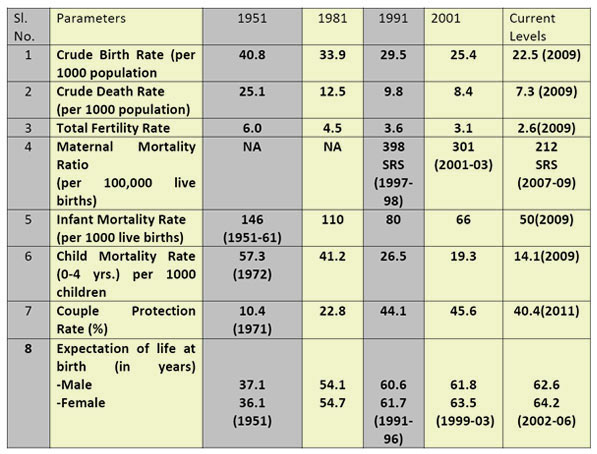 Crude Birth Rate (CBR): Decline in the Crude Birth Rate from 29.5 in 1991 to 22.5 in 2009. The CBR is higher (24.1) in rural areas as compared to urban areas (18.3). Uttar Pradesh recorded the highest CBR (28.7) and Goa, the lowest (13.5). 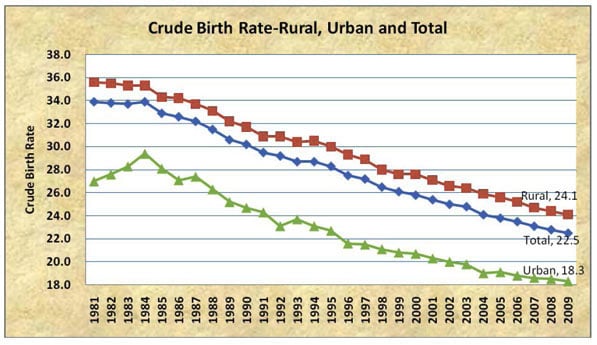 Crude Death Rate (CDR): Crude death rate indicates the total number of deaths per year per 1,000 people. Decline in Crude death Rate from 7.4 in 2008 to 7.3 in 2009. The CDR is higher (7.8) in rural areas as compared to urban areas (5.8). The death rate is highest (8.8) in Orissa and lowest in Nagaland (3.6).  |
| Estimated Birth rate, Death rate, Natural Growth rate and Infant mortality rate, 2009 | ||||||||||||
| India/States/Union Territories | Birth Rate | Death rate | Natural Growth Rate | Infant Mortality Rate | ||||||||
| Total | Rural | Urban | Total | Rural | Urban | Total | Rural | Urban | Total | Rural | Urban | |
| 1 | 2 | 3 | 4 | 5 | 6 | 7 | 8 | 9 | 10 | 11 | 12 | 13 |
| India | 22.5 | 24.1 | 18.3 | 7.3 | 7.8 | 5.8 | 15.2 | 16.3 | 12.5 | 50 | 55 | 34 |
| Bigger States | ||||||||||||
| Andra Pradesh | 18.3 | 18.8 | 17.0 | 7.6 | 8.5 | 5.5 | 10.6 | 10.3 | 11.5 | 49 | 54 | 35 |
| Assam | 23.6 | 24.9 | 15.9 | 8.4 | 8.8 | 5.9 | 15.2 | 16.1 | 10.1 | 61 | 64 | 37 |
| Bihar | 28.5 | 29.3 | 22.2 | 7.0 | 7.2 | 5.8 | 21.5 | 22.1 | 16.5 | 52 | 53 | 40 |
| Chhattisgarh | 25.7 | 27.2 | 19.0 | 8.1 | 8.5 | 6.4 | 17.6 | 18.8 | 12.6 | 54 | 55 | 47 |
| Delhi | 18.1 | 19.9 | 17.8 | 4.4 | 4.8 | 4.3 | 13.8 | 15.0 | 13.5 | 33 | 40 | 31 |
| Gujarat | 22.3 | 23.8 | 19.9 | 6.9 | 7.7 | 5.6 | 15.4 | 16.1 | 14.3 | 48 | 55 | 33 |
| Haryana | 22.7 | 23.8 | 20.1 | 6.6 | 7.1 | 5.7 | 16.0 | 16.7 | 14.5 | 51 | 54 | 41 |
| Jammu & Kashmir | 18.6 | 19.9 | 13.7 | 5.7 | 6.0 | 4.7 | 12.8 | 13.9 | 9.0 | 45 | 48 | 34 |
| Jharkhand | 25.6 | 27.1 | 19.2 | 7.0 | 7.4 | 5.3 | 18.6 | 19.7 | 13.9 | 44 | 46 | 30 |
| Karnataka | 19.5 | 20.6 | 17.6 | 7.2 | 8.3 | 5.3 | 12.3 | 12.3 | 12.3 | 41 | 47 | 31 |
| Kerala | 14.7 | 14.6 | 14.9 | 6.8 | 6.8 | 6.5 | 7.9 | 7.8 | 8.3 | 12 | 12 | 11 |
| Madhya Pradesh | 27.7 | 29.7 | 20.8 | 8.5 | 9.2 | 6.1 | 19.2 | 20.5 | 14.8 | 67 | 72 | 45 |
| Maharashtra | 17.6 | 18.1 | 16.9 | 6.7 | 7.6 | 5.5 | 10.9 | 10.6 | 11.4 | 31 | 37 | 22 |
| Orissa | 21.0 | 21.9 | 15.7 | 8.8 | 9.2 | 6.8 | 12.2 | 12.7 | 8.9 | 65 | 68 | 46 |
| Punjab | 17.0 | 17.7 | 15.8 | 7.0 | 7.8 | 5.8 | 9.9 | 9.9 | 10.1 | 38 | 42 | 31 |
| Rajasthan | 27.2 | 28.4 | 23.2 | 6.6 | 6.7 | 6.1 | 20.6 | 21.7 | 17.1 | 59 | 65 | 35 |
| Tamil Nadu | 16.3 | 16.5 | 16.0 | 7.6 | 8.5 | 6.6 | 8.6 | 8.0 | 9.4 | 28 | 30 | 26 |
| Uttar Pradesh | 28.7 | 29.7 | 24.7 | 8.2 | 8.6 | 6.5 | 20.5 | 21.1 | 18.3 | 63 | 66 | 47 |
| West Bengal | 17.2 | 19.1 | 12.1 | 6.2 | 6.1 | 6.4 | 11.0 | 13.0 | 5.7 | 33 | 34 | 27 |
| Smaller States | ||||||||||||
| Arunachal Pradesh | 21.1 | 22.6 | 14.9 | 6.1 | 7.0 | 2.5 | 15.0 | 15.6 | 12.4 | 32 | 35 | 14 |
| Goa | 13.5 | 13.0 | 13.9 | 6.7 | 8.2 | 5.8 | 6.8 | 4.8 | 8.1 | 11 | 11 | 10 |
| Himachal Pradesh | 17.2 | 17.8 | 11.7 | 7.2 | 7.4 | 4.9 | 10.0 | 10.4 | 6.8 | 45 | 46 | 28 |
| Manipur | 15.4 | 15.4 | 15.5 | 4.7 | 4.6 | 5.0 | 10.7 | 10.8 | 10.5 | 16 | 18 | 11 |
| Meghalaya | 24.4 | 26.4 | 15.0 | 8.1 | 8.6 | 5.7 | 16.3 | 17.9 | 9.4 | 59 | 61 | 40 |
| Mizoram | 17.6 | 21.7 | 13.2 | 4.5 | 5.0 | 4.1 | 13.0 | 16.7 | 9.2 | 36 | 45 | 19 |
| Nagaland | 17.2 | 17.4 | 16.3 | 3.6 | 3.7 | 3.1 | 13.6 | 13.7 | 13.2 | 26 | 27 | 23 |
| Sikkim | 18.1 | 18.4 | 16.0 | 5.7 | 6.0 | 3.9 | 12.3 | 12.4 | 12.1 | 34 | 36 | 21 |
| Tripura | 14.8 | 15.5 | 11.6 | 5.1 | 5.0 | 5.5 | 9.7 | 10.5 | 6.1 | 31 | 33 | 20 |
| Uttarakand | 19.7 | 20.6 | 16.3 | 6.5 | 6.9 | 5.2 | 13.2 | 13.7 | 11.0 | 41 | 44 | 27 |
| Union Territories | ||||||||||||
| Andaman & Nicobar Islands | 16.3 | 16.5 | 16.1 | 4.1 | 4.4 | 3.6 | 12.2 | 12.0 | 12.5 | 27 | 31 | 20 |
| Chandigarh | 15.9 | 22.1 | 15.3 | 3.9 | 3.9 | 3.9 | 12.0 | 18.2 | 11.4 | 25 | 25 | 25 |
| Dadra & Nagar Haveli | 27.0 | 26.5 | 28.8 | 4.8 | 5.2 | 3.7 | 22.1 | 21.3 | 25.2 | 37 | 41 | 24 |
| Damman & Diu | 19.2 | 19.6 | 18.6 | 5.1 | 5.5 | 4.4 | 14.2 | 14.1 | 14.2 | 24 | 21 | 30 |
| Lakshadweep | 15.0 | 15.5 | 14.6 | 5.8 | 5.4 | 6.3 | 9.2 | 10.1 | 8.3 | 25 | 22 | 28 |
| Puduchery | 16.5 | 17.1 | 16.2 | 7.0 | 7.4 | 6.8 | 9.5 | 9.7 | 9.4 | 22 | 28 | 19 |
| Note: Infant mortality rates for Smaller States and Union Territories are based on three-years period 2007-09. | ||||||||||||
|
Life Expectancy:
Life expectancy is defined as the average number of additional years a person could expect to live if current mortality trends were to continue for the rest of that person's life. It is a standard indicator for the level of socio-economic development. 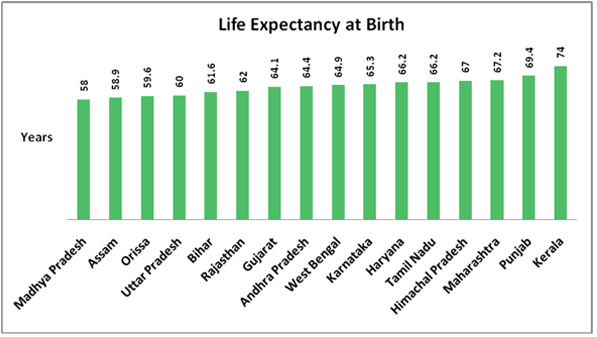
Kerala stands first with a life expectancy of 74 years while Madhya Pradesh has the lowest life expectancy of 58 years. Life Expectancy- Projection. Interpretation: A continuous rise in the life expectancy at birth over the years. |

Subscribe to our Free Newsletters!

Disclaimer - All information and content on this site are for information and educational purposes only. The information should not be used for either diagnosis or treatment or both for any health related problem or disease. Always seek the advice of a qualified physician for medical diagnosis and treatment.
Full Disclaimer
Advertise with us | Medindia Copyright | Privacy Policy | Terms of Use © All Rights Reserved 1997 - 2024
 Careers